

How to reset calculation groups in a custom tooltip or drillthrough page
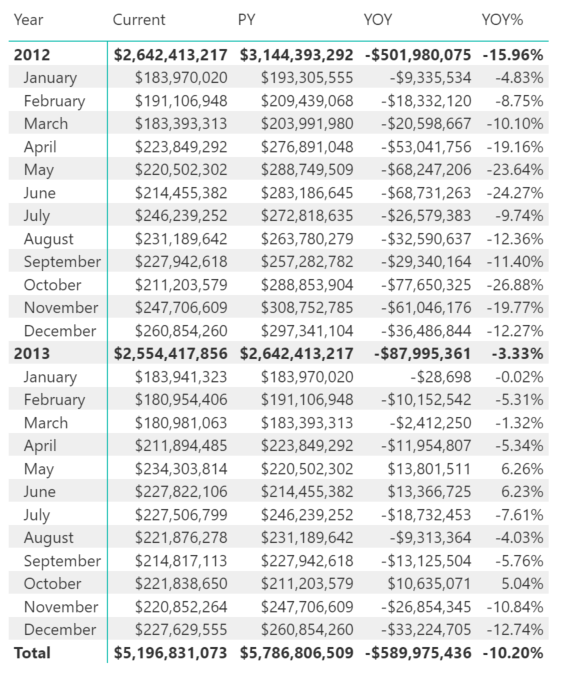
I was faced with an interesting challenge with calculation groups recently. Say you’ve got a standard time intelligence matrix built out using calculation groups 1 . In this case, we’ve got a matrix which shows the current year sales, prior year sales and year-on-year change for each month. Using the Contoso dataset, it might look something like this…
Adding a custom tooltip
I wanted to add a custom tooltip, to allow users to dig even deeper. I was aiming to show how these values broke down across different product categories.
The simplest implementation is to copy this same matrix into a custom tooltip page, and replace the months on the rows with the product category. In doing this, you can see the category breakdown, but only for the calculation item that you’re currently hovering over, as highlighted below.
Note how the total value in the tooltip matches the value that we hover over in the main matrix. The tooltip calculates the correct values, but unfortunately filters the values down to just a single calculation item at a time.


Showing multiple calculation items at once
If we want to show all of the calculation items, we can create a measure that directly applies a given calculation group. For example, we can define this measure to return the Total Sales in the previous year, using the logic in the PY calculation item.
FORMAT (
CALCULATE ( [Total Sales], 'Time Intelligence'[Calculation] = "PY" ),
"$#,##0"
)
The FORMAT part is important to make sure the measure doesn’t inherit any format strings from the calculation items in the matrix.
The same can be done for our current year sales.
FORMAT (
CALCULATE ( [Total Sales], 'Time Intelligence'[Calculation] = "Current" ),
"$#,##0"
)
With these defined, we can remove the calculation group for the columns of the matrix in our tooltip. Then we can add our measure for the current and previous year sales. This will give us the correct values when we hover over our current year sales column…

But we get some strange results when we inspect the other columns…

In particular, when we hover over YOY, the tooltip is telling us that there were no sales last year! Something’s definitely gone wrong here.
What’s the problem? Filter context (as usual)
The reason we’re getting the wrong calculation is that the tooltip is generating it’s results based on the values made available to it in the current filter context.
When we hover over YOY, the columns in the tooltip have two calculation items applied.
For Total Sales CY, it has both the Current item (in the tooltip) and the YOY item (from the main matrix) applied. But since Current is just defined as SELECTEDMEASURE(), the net result is to return the YOY values in the Total Sales CY column.
For Total Sales PY, it has values for the previous year (in the tooltip) inserted as the current year values when evaluating the YOY item (from the main matrix). Looking at the calculation item definitions 1 , you can substitute the definition for PY into YOY whenever SELECTEDMEASURE() appears. This will show you why the result ends up as zero for every value.
How can we solve this?
To get this working as intended, we need a way to remove the filter context of the calculation group in the main matrix. I.e. when we hover over YOY, the YOY calculation item shouldn’t be passed through to the tooltip as a filter.
If all this talk of removing filter contexts made you think of applying an ALL function, you’ve earned the right to be quite chuffed with yourself :)
To negate the effect of the main Time Intelligence calculation group, we have to use the ALL filter from within a second calculation group. We can use this new group to toggle the effect of the first group on and off.
This simpler group, which I’ve called ‘Disable Time Intelligence’[State], has a single calculation item named “Disabled”…
-- Calculation Group: 'Disable Time Intelligence'[State]
-- Precedence: 2
---------------------------------------------------------
-- Calculation Item: Disabled
CALCULATE ( SELECTEDMEASURE (), ALL ( 'Time Intelligence' ) )
For this to work correctly in your tooltip, you need to do two things…
Ensure that this calculation group has a higher precedence than the orginal Time Intelligence group. This means that this calculation item will get applied by the Vertipaq engine before the time intelligence calculation item in the matrix. So even though the tooltip may be hovering over a matrix cell in the PY column, the ALL statement over the calculation group overrules the PY calculation.
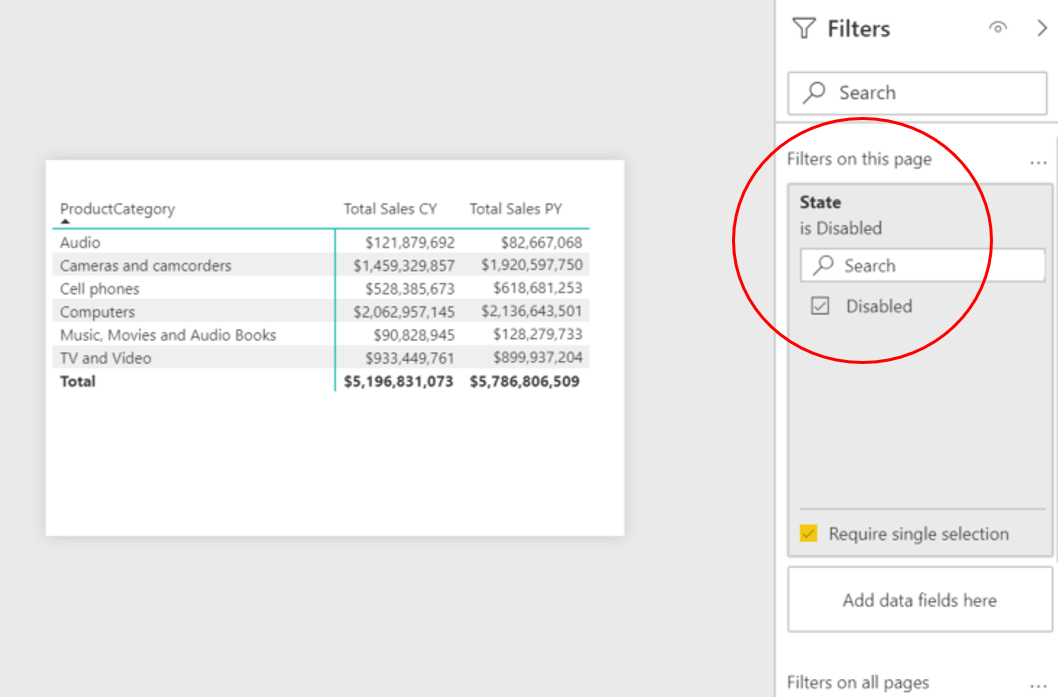
Add ‘Disable Time Intelligence’[State] group to the page-level filters for the tooltip, and select “Disabled” as below.
Once you’ve set these up, here’s what the tooltip looks like in action. When the same month is selected on the matrix rows, the tooltip always returns the same calculations no matter which matrix row is selected.

Wait, how does this work exactly?
Why does ‘Disable Time Intelligence’ apply to the main matrix, but not to the tooltip?
This is because the ALL statement allows us to ignore any filters applied to the Time Intelligence calculation group. So the main matrix has the selected calculation item filtered out.
But then the measures in the tooltip page (Total Sales CY and Total Sales PY) use CALCULATE to reapply the calculation items, after having removed them with the ALL statement in the “Disabled” calculation item.
What about drillthrough pages?
Fortunately, this logic applies equally well to drillthrough pages. If we duplicate our tooltip page and make it a drillthrough page instead (drilling down on the Total Sales measure), we get the same result…

Summary
Calculation groups can be confusing at times, espacially when you start trying to apply multiple groups or items at once. Like most instances when DAX calculations don’t return the expected values, one of your best tools to solve the problem is to carefully consider what the filter context for the calculation is. Once you have that figured out, solving the problem can be much easier - it certainly was for me when I tackled this problem!
Try it out for yourself!
Download the Power BI report file I used in this post to play around and build your own understanding hands-on.
-
Here are the full definitions for the 'Time Intelligence' calculation group and calculation items used in this example. ↩
---------------------------------------------------------
-- Calculation Group: 'Time Intelligence'[Calculation]
-- Precedence: 1
---------------------------------------------------------
-- Calculation Item: Current
-- Format String = "$#,##0"
SELECTEDMEASURE ()
-- Calculation Item: PY
-- Format String = "$#,##0"
CALCULATE ( SELECTEDMEASURE (), SAMEPERIODLASTYEAR ( Calendar[DateKey] ) )
-- Calculation Item: YOY
-- Format String = "$#,##0"
VAR CurrentMeasure =
SELECTEDMEASURE ()
VAR PriorMeasure =
CALCULATE ( SELECTEDMEASURE (), 'Time Intelligence'[Calculation] = "PY" )
RETURN
IF (
CurrentMeasure = BLANK ()
|| PriorMeasure = BLANK (),
BLANK (),
CurrentMeasure - PriorMeasure
)
-- Calculation Item: YOY%
-- Format String = "0.00%"
DIVIDE (
CALCULATE ( SELECTEDMEASURE (), 'Time Intelligence'[Calculation] = "YOY" ),
CALCULATE ( SELECTEDMEASURE (), 'Time Intelligence'[Calculation] = "PY" )
)