

Displaying ordinal numbers in your Power BI Smart Narratives
In using the Smart Narratives feature for Power BI, I’ve found a few tricks to make your narratives even easier to read. One trick I’ve used is to show values in a ranking in a more readable fashion. For example, say you used Smart Narratives to show the sales performance for a given state. If the state of Victoria came in 3rd best for sales by each state, then you might want your narrative to return something like this…
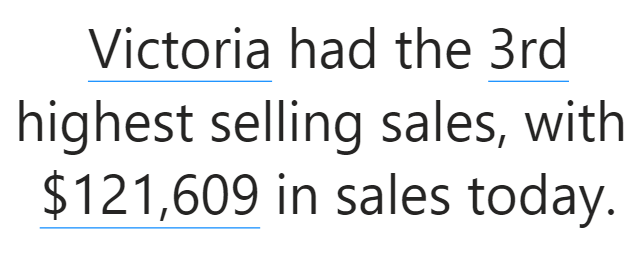
So how can you get this to read as the “3rd” highest selling sales, including that ordinal suffix (the ‘rd’ after the 3) on the end? With a bit of DAX, you can get the right suffix showing for these ranked values, and make your Smart Narratives even smarter!
How you can present ordinal suffixes
Besides the above example, I’ve used this kind of technique to add context to a cohort analysis with a custom tooltip page.
In the report screenshot below, I’ve got a matrix visual that shows the first month that a customer made purchases on the rows (i.e. the cohort) and the number of months after their first purchase on the columns. The measure in the matrix shows how many customers from that cohort made a purchase in that month.
When you hover over each cell in the matrix, a custom tooltip appears which generates a smart narrative to explain the cohort’s behavior in more detail. In the tooltip, the highlighted line indicates that we’re considering the column indexed at 4, i.e. the customers 4th month after their first purchase.

If you want to play with this report yourself, you can check it out here.
Using DAX to display suffixes
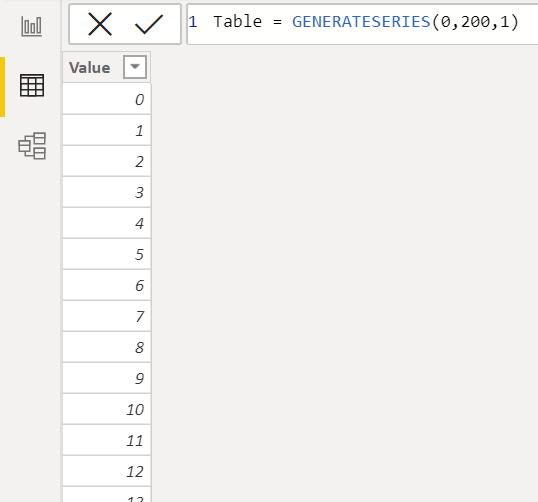
To build out a measure to include the ordinal suffix, we need a field that returns a list of numbers. To keep things simple, we can generate this list using a calculated table.
Now we can define a measure that takes each number in the current context and works out what suffix to use. The measure will then append the suffix to the number using the FORMAT function. He’s what the full measure looks like.
VAR Last2Digits =
RIGHT ( SUM ( 'Table'[Value] ), 2 )
VAR LastDigit =
RIGHT ( SUM ( 'Table'[Value] ), 1 )
VAR Suffix =
SWITCH (
TRUE (),
Last2Digits IN { "11", "12", "13" }, "th",
LastDigit = "1", "st",
LastDigit = "2", "nd",
LastDigit = "3", "rd",
"th"
)
RETURN
FORMAT ( SUM ( 'Table'[Value] ), "0" & Suffix )
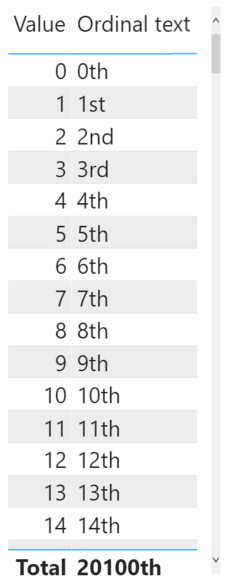
Here’s how the measure looks when we apply it against our values in a table visual.
Working out which suffix to use
The Suffix variable is what ensures we display the right suffix. The standard rule is that “if a number ends in a 1, then the suffix should be ‘st’, as in ‘first’ “, and similarly for 2nd and 3rd. But the exception to this rule is for 11, 12 and 13, which should read as 11th, 12th and 13th, respectively. So the variable checks the selected value for this exception, then it checks for the standard 1-2-3 rule, and if it doesn’t need to apply either of those it will return the standard ‘th’ suffix.
Allowing for aggregations
Note here that I’ve chosen to use a SUM aggregation in my measure, rather than using SELECTEDVALUE. This is intentional, since we may want to do some calculations and arrive at a new number before finding and applying the suffix. You can see the effect of this in the totals row of the visual. The sum of all the values in the table is computed as 20100, and then the logic in the measure determines that the appropriate suffix for this measure is ‘th’, so it presents the final output as a string that reads “20100th”.
Try it out for yourself!
You can take the exact same logic and apply it to any of your own calculations. All you have to do is replace the references to SUM(‘Table’[Value]) with your own measure.