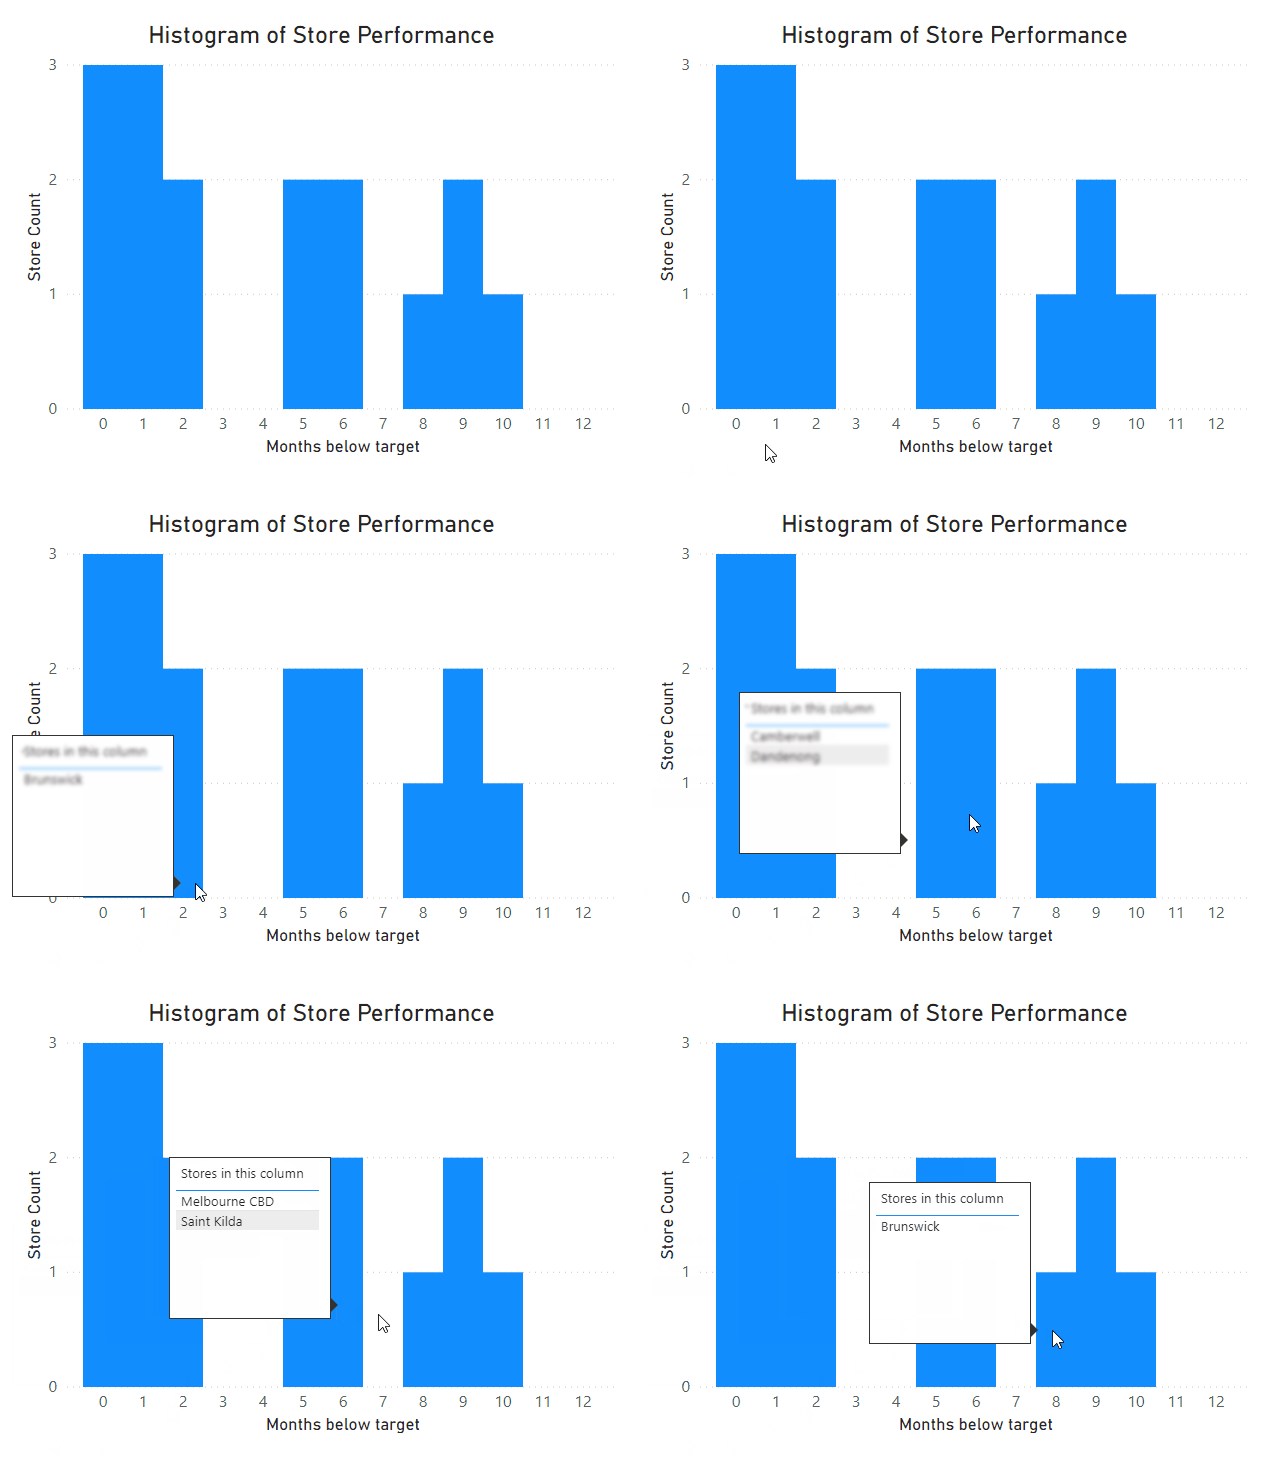
How to make Histograms in Power BI to answer business questions
Histograms are commonly used in statistics, but they can also be useful for answering business questions. However it’s not immediately obvious how to set them up in Power BI, so we’re going to go through a few techniques for how to build them to address a business scenario. Our end result will have the flexibility to slice on different values, and will give us a custom tooltip with additional insights.
