

Dealing with Gaps and Islands in Power Query
In my last blog post, I discussed how you can take a range of dates defined by a start and end date, and convert that into a complete list of dates. There are some cases where you may want to do the reverse: you may have been provided with a list of dates marked against a number of categories, and you want to group into a start date and end date for each category.
However this situation is a bit trickier — if your date list has gaps where dates are missing, how are you supposed to handle those cases and still get meaningful results? Read on to find out…
The simple (but dangerous) solution — Group By
In the example of school holidays discussed in the last post, getting the holiday start and end dates is straighforward. You can just take your date list, group by the holiday name and return the minimum and maximum dates for each holiday period.


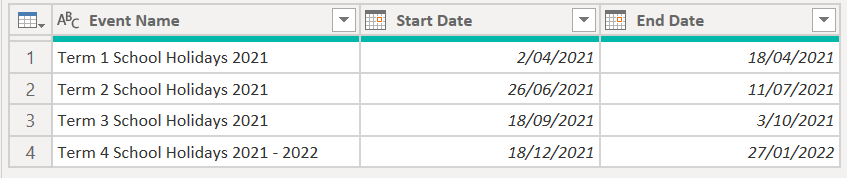
This works fine when your dates are contiguous, as is the case for school holiday periods. But you can come across some important issues to consider when this isn’t the case.
In another example, say we were dealing with a retail store, and we want to know which salesperson had the longest streak of days for which they had the highest sales. If we just look at two week's worth of data, here's the top salesperson for each day…

If we look at the raw data with each salesperson highlighted, we can clearly see that Natasha has the longest streak of 4 days.

However, if we were to apply the same Group By technique as above, here's what we get for our start and end dates for each salesperson's streak…

This output would suggest that it was actually Omar who had the longest streak! But clearly this is incorrect, as it hasn’t accounted for the gaps in Omar's tenure as top salesperson. If we want to get this logic working properly, we'll need to use an approach called Gap and Island analysis.
What is Gap and Island analysis?
Whenever we're dealing with an ordered sequence of values (like dates or integers), we may have clusters of values that all occur contiguously, which we'll call islands. Between these islands of values in the sequence, we will have missing values, which we'll call gaps.
When we're dealing with event data (i.e. a dataset with a date/time element), there are plenty of scenarios in which we would want to identify these gaps and islands. Besides the top salesperson streak problem above, we may want to know…
All the periods during which a customer was active or inactive.
Which dates we are missing data for in an incomplete dataset (e.g. when you’ve got hundreds of daily data extracts).
How many days a city has gone without a case of COVID community transmission.
Gap and Island analysis provides approaches for answering these questions. There have been articles written previously on how to deal with gaps and islands in SQL, but I've yet to come across any other articles that illustrate how to approach it in Power Query. So let’s tackle this challenge together!
Identifying islands in a list of dates
With that context out of the way, let's jump back to our salesperson example. For us to automatically determine which salesperson had the longest streak, we have to identify all the islands during which each staff member had the highest sales. Then we can look at which island had the longest duration, and this will tell us our winner.
Let's start by just looking at the data for Natasha. To group up her dates into islands, we'll need to do the following transforms…
1. Clean up our data by removing duplicates and sorting the dates chronologically. Note that these steps don't alter our dataset for this example, but if your own datasets are unordered and contain duplicates, then skipping this step may give you incorrect results.
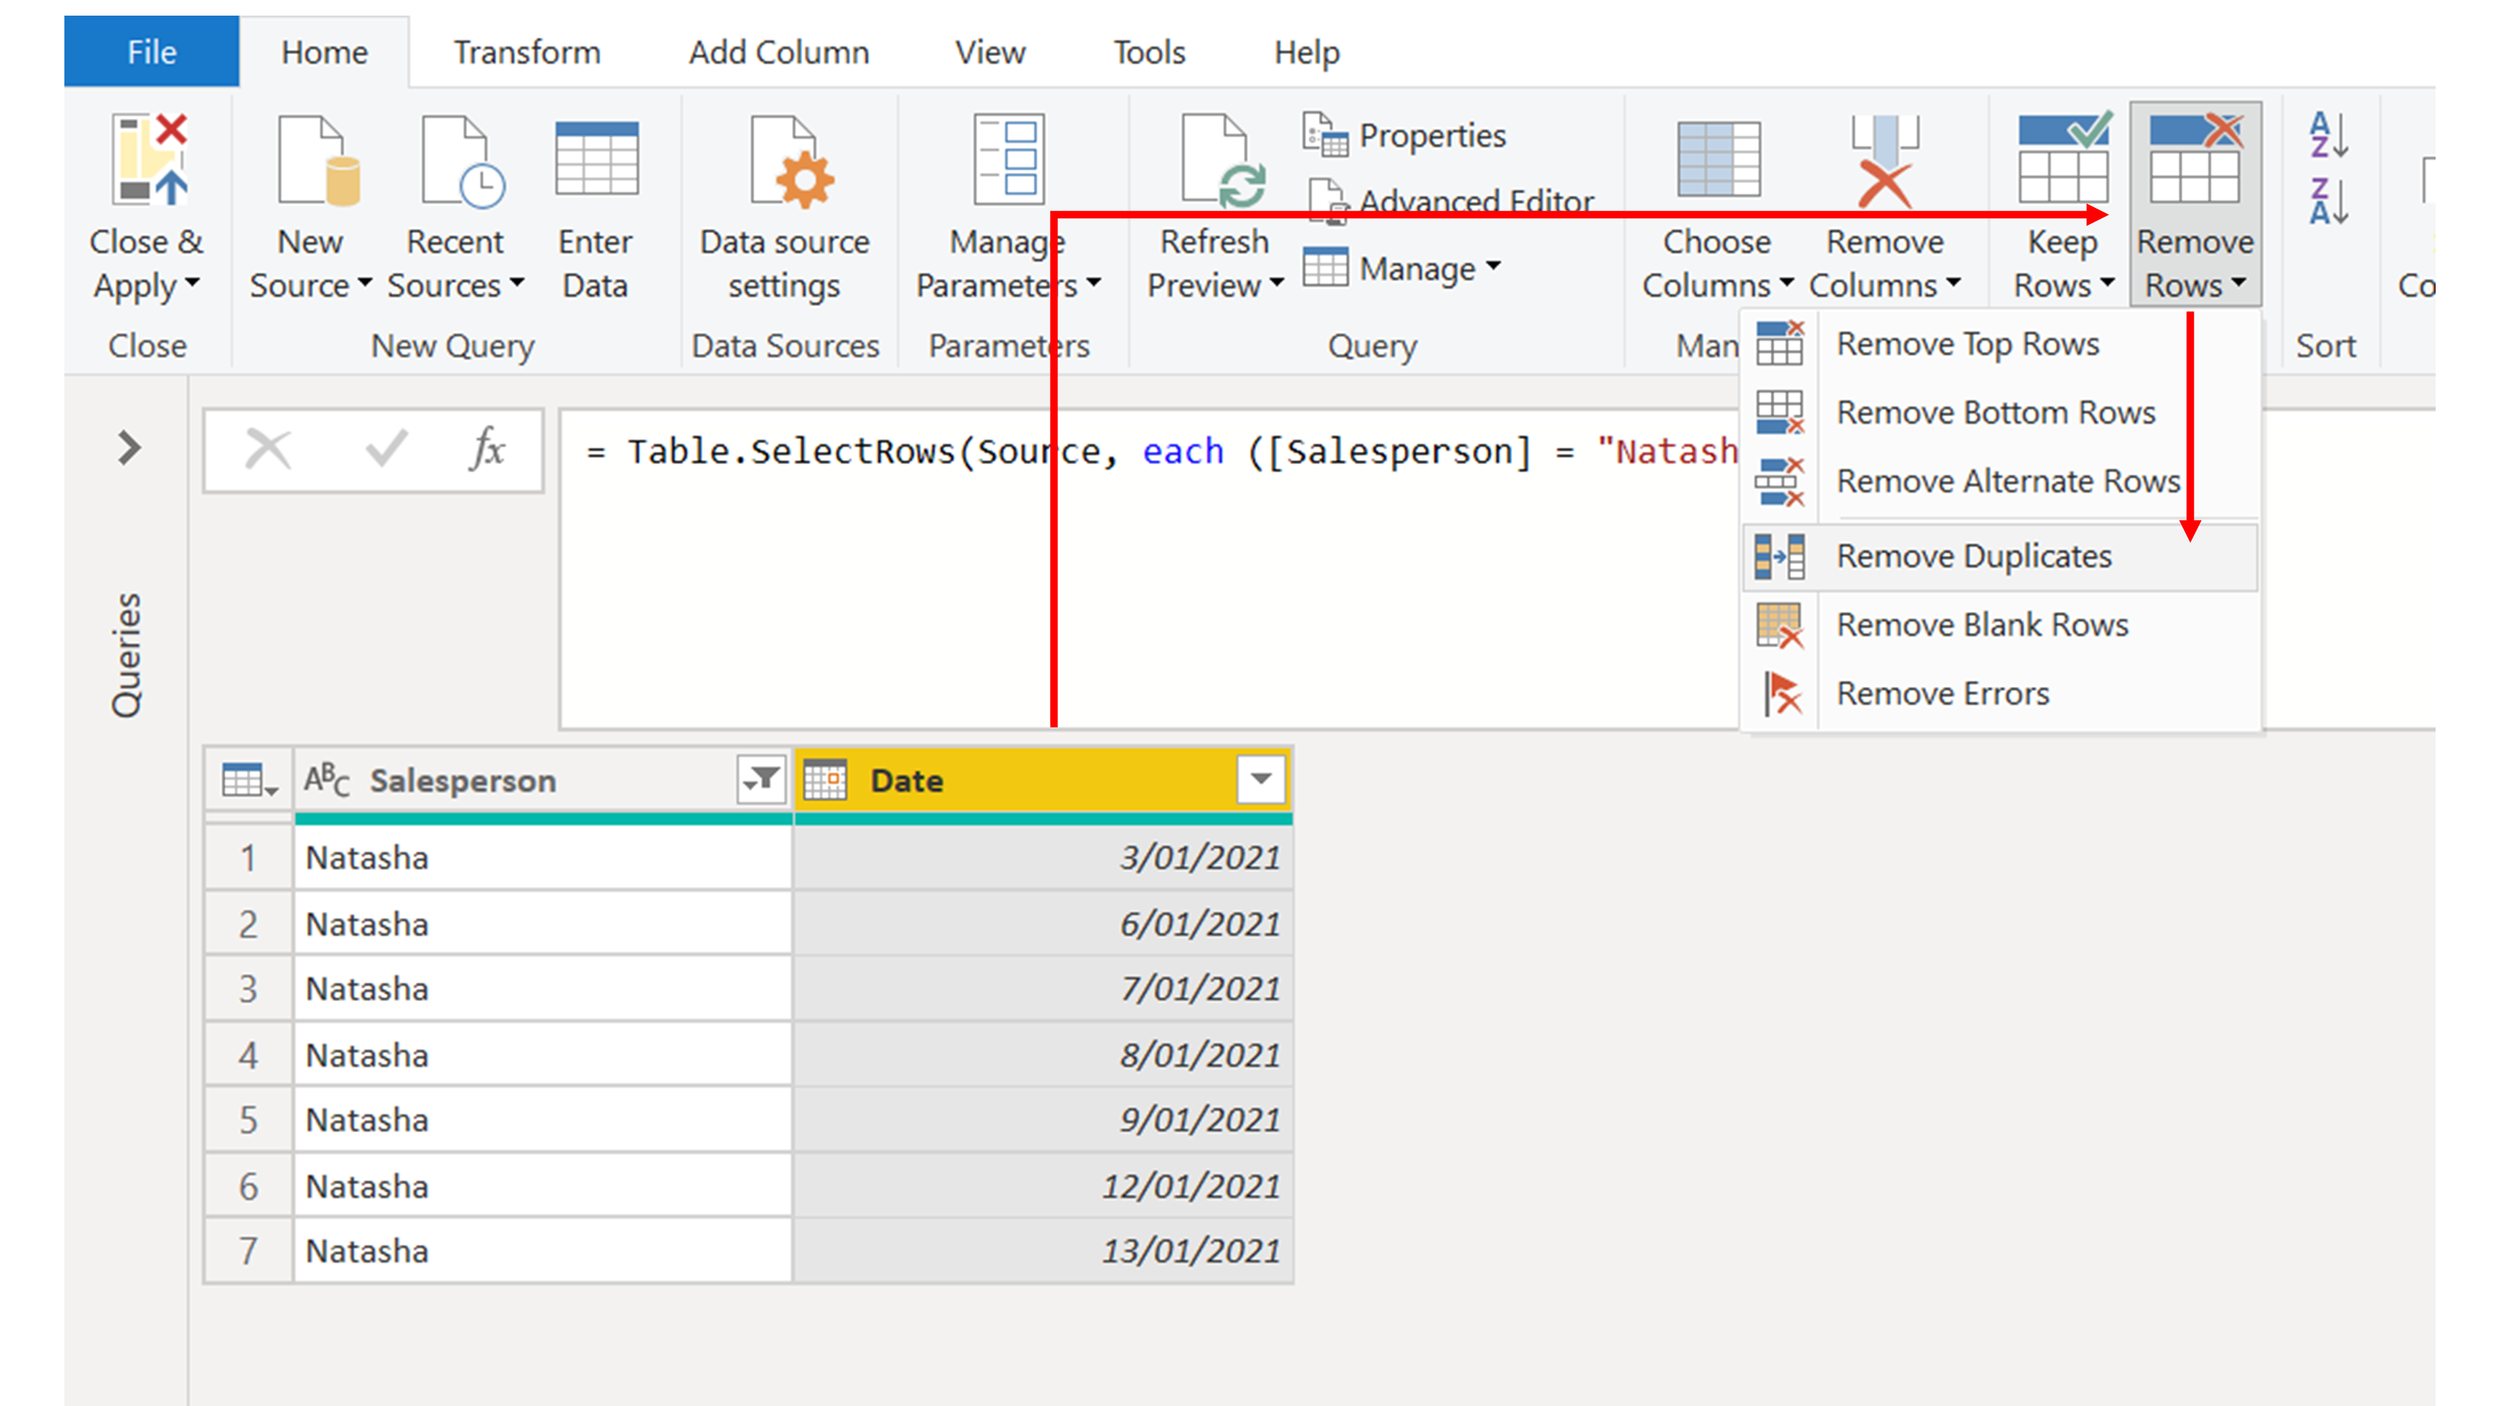

2. Duplicate the Date column, and convert it into an integer. I’ve renamed this column as Date Value.


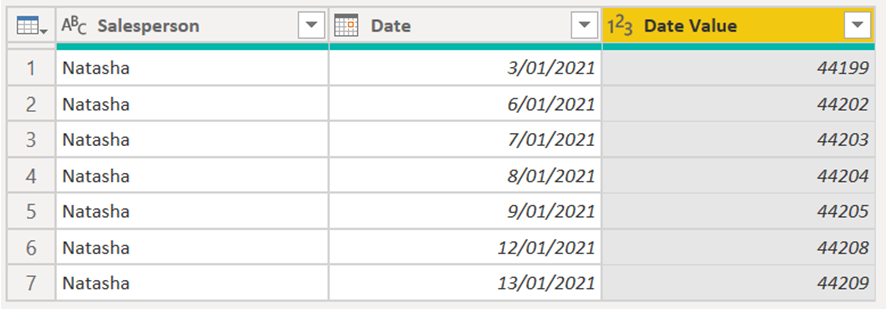
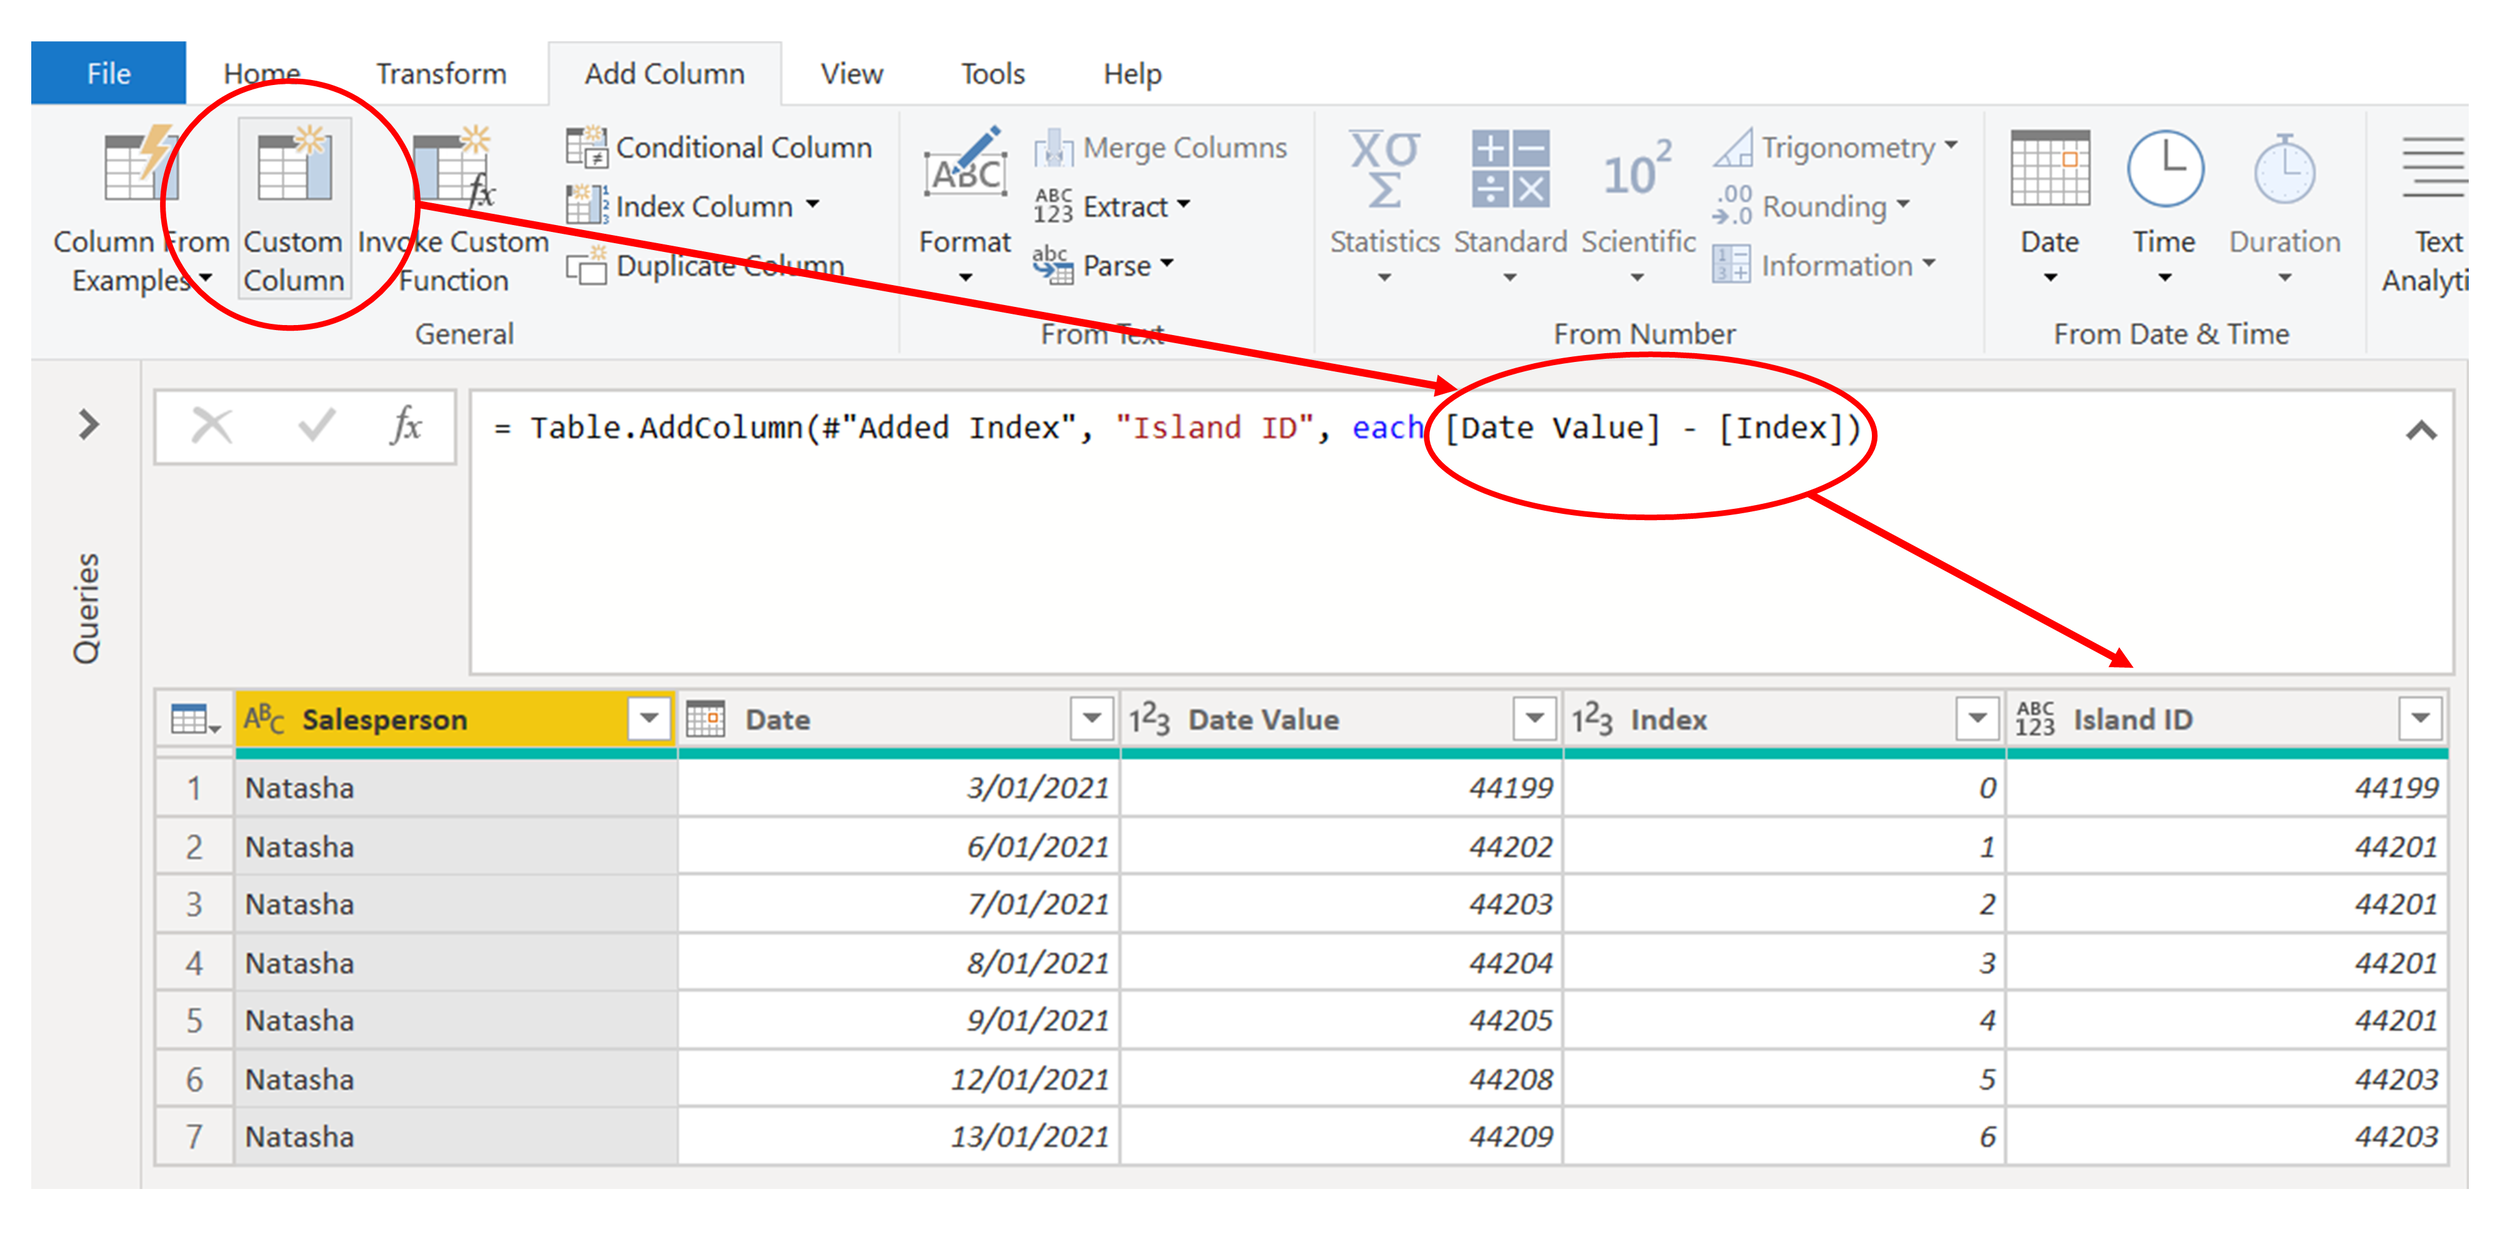
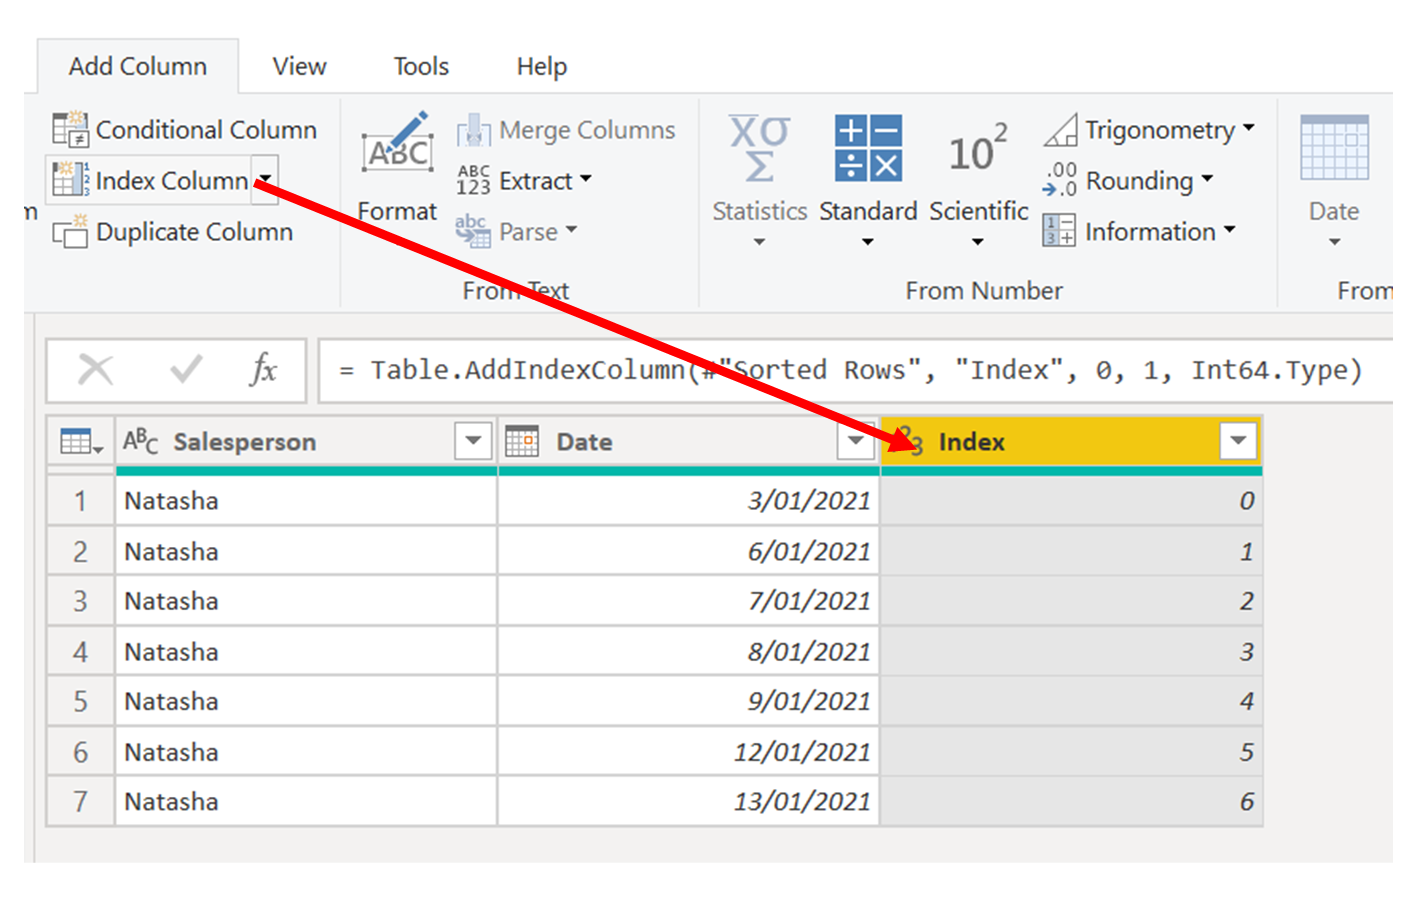
3. Add an Index Column.

4. Add a new custom column which subtracts Date Value from Index. I've called the new column Island ID because it uniquely identifies each cluster of dates. Whenever two dates in the list are contiguous, both the date value and the index increase by 1, so the value for Island ID is the same for both dates. If there is a gap between the dates, then the date value will jump by more than 1, so Island ID will change to a different value.
5. Group each Island ID, returning the min and max Date for each island. This is the same logic that we initially used, but instead of grouping dates for each staff member, we're grouping them for each island of each staff member.


6. Remove the Island ID column, since we only needed it to perform this grouping.


Expanding the logic to all staff
Now that we've got the grouping working for one staff member, we'll have to apply this logic to our list of all staff members. In order to do this, we would need to group up our original list of salespeople, and apply the above logic as a custom function, as seen below. Note how the initial data preview for Natasha groups all her rows, but after applying the custom function we get the same islands as we got when we did this manually above.
We can then re-expand our table column to get the full list of islands for all our staff members. There’s also some clean up after that to restore the date types to the new columns.


Now that we’ve got each of our separate islands, we can add a column that computes the number of days for each streak. From this, we see that Natasha did indeed have the longest streak of 4 days.

Custom function to return all islands
If you want to apply all of this in a single step, here’s a custom function I’ve called fn_Date_Islands() that you can use to identify islands among a group of dates.
The function contains the logic both for working out the islands for an individual salesperson (or more generally, an individual category), and for extending this to all salespeople.
I've also generalised it so that you can specify the name of the Category against which islands may exist (i.e. Salesperson in this example), the name of the Date column, and the name of the output columns for Start Date and End Date…
// Function definition
fn = (source_table as table, category_column_name as text, optional date_column_name as text, optional start_date_column_name as text, optional end_date_column_name as text) =>
let
// Define inner function that returns islands for each eategory
fn_Group_Islands_By_Category =
(source_table as table, optional date_column_name as text, optional start_date_column_name as text, optional end_date_column_name as text) =>
let
// If column names are not provided, use defaults.
Date_Column_Name = if date_column_name is null then "Date" else date_column_name,
Start_Date_Column_Name = if start_date_column_name is null then "Start Date" else start_date_column_name,
End_Date_Column_Name = if end_date_column_name is null then "End Date" else end_date_column_name,
Source = source_table,
// This step explicitly renames the date column. This ensures that you can consistently reference the column in later steps, no matter what the original name was.
#"Renamed Columns" = Table.RenameColumns(Source,{{Date_Column_Name, "Date"}}),
// We only need the date list itself.
#"Removed Other Columns" = Table.SelectColumns(#"Renamed Columns",{"Date"}),
// In case dates are entered incorrectly, remove errors.
#"Removed Errors" = Table.RemoveRowsWithErrors(#"Removed Other Columns", {"Date"}),
// Indexing in later step relies on having a unique date list.
#"Removed Duplicates" = Table.Distinct(#"Removed Errors"),
// Dates need to be in chronological order to identify gaps and islands.
#"Sorted Rows" = Table.Sort(#"Removed Duplicates",{{"Date", Order.Ascending}}),
#"Added Index" = Table.AddIndexColumn(#"Sorted Rows", "Index", 0, 1, Int64.Type),
// The difference between the index and the date (when represented as an integer) uniquely identifies an island.
#"Added Island ID" = Table.AddColumn(#"Added Index", "Island ID", each Number.From([Date])-[Index]),
// The islands are each self-contained, so we're safe to aggregate here to get start and end dates.
#"Grouped Date by Island" = Table.Group(#"Added Island ID", {"Island ID"}, {{Start_Date_Column_Name, each List.Min([Date]), type nullable date}, {End_Date_Column_Name, each List.Max([Date]), type nullable date}}),
#"Removed Island ID" = Table.RemoveColumns(#"Grouped Date by Island",{"Island ID"})
in
#"Removed Island ID",
// If column names are not provided, use defaults.
Date_Column_Name = if date_column_name is null then "Date" else date_column_name,
Start_Date_Column_Name = if start_date_column_name is null then "Start Date" else start_date_column_name,
End_Date_Column_Name = if end_date_column_name is null then "End Date" else end_date_column_name,
Source = source_table,
#"Grouped by Category" = Table.Group(Source, {category_column_name}, {{"All Rows", each fn_Group_Islands_By_Category(Table.SelectColumns(_,{category_column_name, Date_Column_Name}), Date_Column_Name, Start_Date_Column_Name, End_Date_Column_Name), type table}}),
#"Expanded Islands" = Table.ExpandTableColumn(#"Grouped by Category", "All Rows", {Start_Date_Column_Name, End_Date_Column_Name}, {Start_Date_Column_Name, End_Date_Column_Name}),
#"Restored Date Types" = Table.TransformColumnTypes(#"Expanded Islands",{{Start_Date_Column_Name, type date}, {End_Date_Column_Name, type date}})
in
#"Restored Date Types",
// Function documentation
fnType = type function
(
source_table as
(type table meta [
Documentation.FieldCaption = "Table to transform"
]),
category_column_name as
(type text meta [
Documentation.FieldCaption = "Name of Category to group into Islands",
Documentation.SampleValues = {"Customer","Assignee"}
]),
optional date_column_name as
(type text meta [
Documentation.FieldCaption = "Name of Date column",
Documentation.SampleValues = {"Date", "Sales Date"}
]),
optional start_date_column_name as
(type text meta [
Documentation.FieldCaption = "Name of Start Date column to return",
Documentation.SampleValues = {"Start Date", "Start of Island"}
]),
optional end_date_column_name as
(type text meta [
Documentation.FieldCaption = "Name of End Date column to return",
Documentation.SampleValues = {"End Date", "End of Island"}
])
) as list meta
[
Documentation.Name = "fn_Date_Islands",
Documentation.Description = " This function takes a table of categories assigned to dates, and returns a table of contiguous date periods for each category. By default, the date column in the input table is assumed to be called ""Date"", and the output columns are called ""Start Date"" and ""End Date"". These column names can be adjusted with the optional input parameters. "
]
in
Value.ReplaceType(fn, fnType)
We can take our original dataset and apply this function to get our island groupings in a single step…

How about identifying gaps in dates?
Say that instead of working out who had the longest 'hot' streak, we want to work out who had the longest cold streak. We can extend this approach to work out gaps as well. Here's the steps involved in the logic…
1. Remove duplicates and sort.


2. Add an Index column starting at 0.
3. Add a second index starting at 1, which I'll call Next Index.

4. Merge the query to itself, using the join condition [Next Index] = [Index]. Then expand the join result and call the resulting column Next Date. You'll see that this reproduces the dates list, but shifts it one row up.


5. Add a custom column called Gap Start, which adds one day to the original Date column.


6. Add a custom column called Gap End, which subtracts one day from Next Date.


7. The pairs of Gap Start and Gap End values will contain Gaps that appear to go backwards in time. These false gaps appear for rows that are part of an island, so we want to remove these rows. Do this by filtering rows with the filter condition ([Gap Start] <> [Next Date] and [Gap End] <> null).

8. Remove the intermediary columns to give us our final result.

As before, we can wrap all this into a function and apply it to each staff member. Here’s what we get when we do so…

Note that in Chris's case, he only has a single streak so there are no gaps returned. These null rows can simply be filtered out.
Custom function to return all islands
Here's the full function that returns all gaps for all staff in one step, which I’ve called fn_Date_Gaps(). As with the islands function, you can define the names of the date column, outputted start date column and outputted end date column names as optional parameters.
// Function definition
fn = (source_table as table, category_column_name as text, optional date_column_name as text, optional start_date_column_name as text, optional end_date_column_name as text) =>
let
// Define inner function that returns gaps for each category.
fn_Group_Gaps_By_Category =
(source_table as table, optional date_column_name as text, optional start_date_column_name as text, optional end_date_column_name as text) =>
let
// If column names are not provided, use defaults.
Date_Column_Name = if date_column_name is null then "Date" else date_column_name,
Start_Date_Column_Name = if start_date_column_name is null then "Start Date" else start_date_column_name,
End_Date_Column_Name = if end_date_column_name is null then "End Date" else end_date_column_name,
Source = source_table,
// This step explicitly renames the date column. This ensures that you can consistently reference the column in later steps, no matter what the original name was.
#"Renamed Columns" = Table.RenameColumns(Source,{{Date_Column_Name, "Date"}}),
// We only need the date list itself.
#"Removed Other Columns" = Table.SelectColumns(#"Renamed Columns",{"Date"}),
// In case dates are entered incorrectly, remove errors.
#"Removed Errors" = Table.RemoveRowsWithErrors(#"Removed Other Columns", {"Date"}),
// Indexing in later step relies on having a unique date list.
#"Removed Duplicates" = Table.Distinct(#"Removed Errors"),
// Dates need to be in chronological order to identify gaps and islands.
#"Sorted Rows" = Table.Sort(#"Removed Duplicates",{{"Date", Order.Ascending}}),
#"Added Index" = Table.AddIndexColumn(#"Sorted Rows", "Index", 0, 1, Int64.Type),
// Used to join to self with offset.
#"Added Next Index" = Table.AddIndexColumn(#"Added Index", "Next Index", 1, 1, Int64.Type),
// Self-join to get next date in list.
#"Merged Index on Next Index" = Table.NestedJoin(#"Added Next Index", {"Next Index"}, #"Added Next Index", {"Index"}, "Join Result", JoinKind.LeftOuter),
#"Expanded Join Result" = Table.ExpandTableColumn(#"Merged Index on Next Index", "Join Result", {"Date"}, {"Next Date"}),
// This new column returns the day after [Date].
#"Added Gap Start" = Table.AddColumn(#"Expanded Join Result", "Gap Start", each Date.AddDays([Date],1), type date),
// This new column returns the day before [Next Date].
#"Added Gap End" = Table.AddColumn(#"Added Gap Start", "Gap End", each Date.AddDays([Next Date],-1), type date),
// A row represents a gap in the date sequence when the next date in the sequence is not the next chronological date. The final record (with a null end date) is invalid since it inspects dates outside of the date sequence.
#"Filtered to valid gaps" = Table.SelectRows(#"Added Gap End", each ([Gap Start] <> [Next Date] and [Gap End] <> null)),
#"Return only gap range dates" = Table.SelectColumns(#"Filtered to valid gaps",{"Gap Start", "Gap End"}),
// Rename based on optional parameters.
#"Renamed gap ranges" = Table.RenameColumns(#"Return only gap range dates",{{"Gap Start", Start_Date_Column_Name}, {"Gap End", End_Date_Column_Name}})
in
#"Renamed gap ranges",
// If column names are not provided, use defaults.
Date_Column_Name = if date_column_name is null then "Date" else date_column_name,
Start_Date_Column_Name = if start_date_column_name is null then "Start Date" else start_date_column_name,
End_Date_Column_Name = if end_date_column_name is null then "End Date" else end_date_column_name,
Source = source_table,
#"Grouped by Category" = Table.Group(Source, {category_column_name}, {{"All Rows", each fn_Group_Gaps_By_Category(Table.SelectColumns(_,{category_column_name, Date_Column_Name}), Date_Column_Name, Start_Date_Column_Name, End_Date_Column_Name), type table}}),
#"Expanded Gaps" = Table.ExpandTableColumn(#"Grouped by Category", "All Rows", {Start_Date_Column_Name, End_Date_Column_Name}, {Start_Date_Column_Name, End_Date_Column_Name}),
#"Restored Date Types" = Table.TransformColumnTypes(#"Expanded Gaps",{{Start_Date_Column_Name, type date}, {End_Date_Column_Name, type date}}),
#"Filtered Categories with no gaps" = Table.SelectRows(#"Restored Date Types", each ([Start Date] <> null and [End Date] <> null))
in
#"Filtered Categories with no gaps",
// Function documentation
fnType = type function
(
source_table as
(type table meta [
Documentation.FieldCaption = "Table to transform"
]),
category_column_name as
(type text meta [
Documentation.FieldCaption = "Name of Category to group into Gaps",
Documentation.SampleValues = {"Customer","Assignee"}
]),
optional date_column_name as
(type text meta [
Documentation.FieldCaption = "Name of Date column",
Documentation.SampleValues = {"Date", "Sales Date"}
]),
optional start_date_column_name as
(type text meta [
Documentation.FieldCaption = "Name of Start Date column to return",
Documentation.SampleValues = {"Start Date", "Start of Island"}
]),
optional end_date_column_name as
(type text meta [
Documentation.FieldCaption = "Name of End Date column to return",
Documentation.SampleValues = {"End Date", "End of Island"}
])
) as list meta
[
Documentation.Name = "fn_Date_Gaps",
Documentation.Description = " This function takes a table of categories assigned to dates, and returns a table of date periods that represent gaps between contiguous date periods. When a category has only a single contiguous date range with no gaps, this category is removed from the function output. By default, the date column in the input table is assumed to be called ""Date"", and the output columns are called ""Start Date"" and ""End Date"". These column names can be adjusted with the optional input parameters. "
]
in
Value.ReplaceType(fn, fnType)
When we apply the function against our original dataset, we get all the gaps. Note that the function filters out all categories/salespeople that have no gaps.
Summary
Knowing how to deal with Gaps and Islands is a good tool to have in your data analysis toolkit.
There are ways to accomplish this with SQL as well, and in cases where you can push the logic upstream to SQL, I find it best to do so. But in cases where you don’t have that luxury, like when your data comes from csv files, then you can use the above functions to solve it with Power Query.
Try it out for yourself!
Download the Power BI report file I used in this post to play around and build your own understanding hands-on.