

Slicing based on OR and XOR conditions in Power BI
Slicers on a report page in Power BI are an effective way to slice and dice your data under different conditions. But one situation that can be challenging to implement effectively is being able to apply multiple slicers, and show the rows that satisfy one condition or the other, not just the rows that satisfy both. In this blog post, I'll show you a simple implementation to allow you to address this scenario.
How do slicers usually work?
The way that slicers work by default is based on filtering data using a logical AND condition. Whenever a visual is generated, the calculation engine in Power BI will consider any filters or slicers applied to the visual, and use those conditions to filter the data model. It will then apply filter context modifiers from any defined CALCULATE statements, and finally it will perform the DAX operation in the measure based on whatever data is remaining after this filtering.
The default filtering behaviour follows an intersect set operation, where it only considers the rows that satisfy all filter conditions at once. Filtering in this manner works well for many situations, but if instead we want to filter based on rows that satisfy one condition or another (i.e. a union operation), then we need to use an alternative approach. I've seen other blogs go through different approaches to achieve this, but they often involve writing complicated measures that can be hard to interpret. Here, I'll take you through a simple implementation of applying this OR logic, and then we'll generalise this approach to XOR conditions (where we only include rows that satisfy one slicer condition or the other, but not both at once) and to aggregated data.
Our scenario
The situation we'll consider comes from a Power BI question that I recently answered online. In this scenario, we have a simple table in our model that looks like the following...
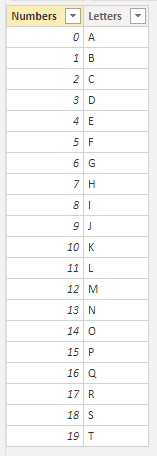
For anyone following along at home, the M code to define the table is also below:
Source = Table.FromColumns(
{List.Generate(() => 0, each _ < 20, each _ + 1), Text.ToList("ABCDEFGHIJKLMNOPQRST")},
{"Numbers", "Letters"}
)
in
Source
Our aim is to have a table visual for these data on our report page, and we want to slice the data based on whether the row contains one of the numbers or one of the letters. The way that one would typically add these slicers is to drag the fields onto the canvas as slicers, and use them to filter the visual. However, this will follow the default filtering behaviour of showing rows satisfying both conditions simultaneously, so we will observe something like this...

In this situation, when we select options on both slicers, we only see the number-letter combinations that satisfy both slicer conditions (i.e. the letter I and number 8). And whenever we make a selection on a slicer, not only does the data table get filtered but the other slicer gets filtered as well. There are straightforward solutions to this issue, such as disabling the interactions between slicers or building the model out as a star schema. But even if we went down one of those paths, our table would still get filtered based on that pesky AND condition.
Adding an OR filter
To achieve OR filtering instead, we have to play a few tricks using some DAX measures and calculated tables. To start with, we'll need to generate two disconnected tables in DAX, which contain all the unique letters and numbers in our main data table...
Numbers = VALUES ( 'Data Table'[Numbers] )
Note that you can do this in Power Query if you prefer, but it doesn't make a significant difference here.
These new tables will ultimately be used as our slicers, but in this scenario it is important to ensure that these new tables do not have a relationship with the main data table. Conventional filtering would require a relationship between the tables for filters to propagate between them, but remember that we are not doing conventional filtering.
If we were to drag these new fields onto the canvas as slicers at this stage, we would find that there is no interaction between our slicers and the data table. This should make sense, since there is no relationship between them. In order to apply our desired OR behaviour, we must now write a custom measure as follows:
IF (
OR (
SELECTEDVALUE ( 'Data Table'[Letters] ) IN ALLSELECTED ( Letters[Letters] ),
// Checks if current letter is in slicer selection
SELECTEDVALUE ( 'Data Table'[Numbers] ) IN ALLSELECTED ( Numbers[Numbers] )
// As above for current number
),
1, // Return 1 if value is selected in one or both of the slicers
0 // Else return 0
)
Once we have this measure, we need to drag it into the visual-level filters for out table visual, and apply the condition of only including rows where the filter equals 1 (i.e. those that satisfy the OR condition). It is important for this to be defined as a measure and not as a calculated column, since the slicers will be changed dynamically and we need our OR logic to also change dynamically. With this filter condition applied, our table visual will now only show rows that follow our desired OR condition.

Extending this to XOR conditions
If you instead wanted to apply an XOR (or exclusive OR) operation, then you can tweak the measure above to satisfy this. We'll just need to add a clause that excludes the rows that satisfy both filter conditions at once. For readability, we'll use variables for the logical filtering conditions in this instance.
VAR One_or_both_slicers =
OR (
SELECTEDVALUE ( 'Data Table'[Letters] ) IN ALLSELECTED ( Letters[Letters] ),
SELECTEDVALUE ( 'Data Table'[Numbers] ) IN ALLSELECTED ( Numbers[Numbers] )
)
VAR Both_slicers =
AND (
SELECTEDVALUE ( 'Data Table'[Letters] ) IN ALLSELECTED ( Letters[Letters] ),
SELECTEDVALUE ( 'Data Table'[Numbers] ) IN ALLSELECTED ( Numbers[Numbers] )
)
RETURN
IF (
One_or_both_slicers && NOT ( Both_slicers ),
1, // Return 1 if value is selected in only one of the slicers
0 // Else return 0
)
Now we can apply this measure as a visual-level filter as before to get the following...

Generalising to aggregated data
This technique works fine when your slicers are at the same grain as the data you are hoping to display. But what about when you want to apply an OR condition to aggregated data? For example, you may want to know the total sales of products that are either sold in Australia or coloured blue. Or in our example, perhaps we want to know the sum of the numbers in rows that fulfil the OR condition, or the first letter alphabetically that fulfils the condition.
The approaches we used above won't work out-of-the-box if we tried to apply it to a visual with aggregated data. This is because the measures we wrote earlier only work when they are evaluated against a single row of the data table, as indicated by the presence of the SELECTEDVALUE statements in their definitions. To apply our logic more generally, we have to dynamically iterate through the table row by row within a single measure evaluation, and then calculate our final output based on the resulting filtered table.
The FILTER function can be used as our iterator here to return a table with only the rows that fulfil our OR condition. Once we have our table, we can use CALCULATE to determine the aggregated value, considering only the rows in the filtered table. Here is how this implementation looks if we calculate the sum of all numbers from rows fulfilling our OR condition...
VAR OR_Rows =
FILTER ( 'Data Table', [OR Filter] = 1 )
RETURN
CALCULATE ( SUM ( 'Data Table'[Numbers] ), OR_Rows )
We can define a similar measure to determine the first letter alphabetically...
VAR OR_Rows =
FILTER ( 'Data Table', [OR Filter] = 1 )
RETURN
CALCULATE ( MIN ( 'Data Table'[Letters] ), OR_Rows )
And of course, we could similarly use the XOR condition instead if it was what the situation demanded. Here's what these implementations end up looking like...

Summary
While filtering based on AND conditions is the default in Power BI, you can still easily achieve filtering based on OR and XOR conditions using a few calculated tables, measures and a bit of DAX know-how. Relationships and star schemas are of course still best practice to follow in general, but in specific scenarios you can achieve more by intentionally straying outside of these guidelines.
Try it out for yourself!
Download the sample Power BI report file I used in this post to play around and build your own understanding hands-on.